
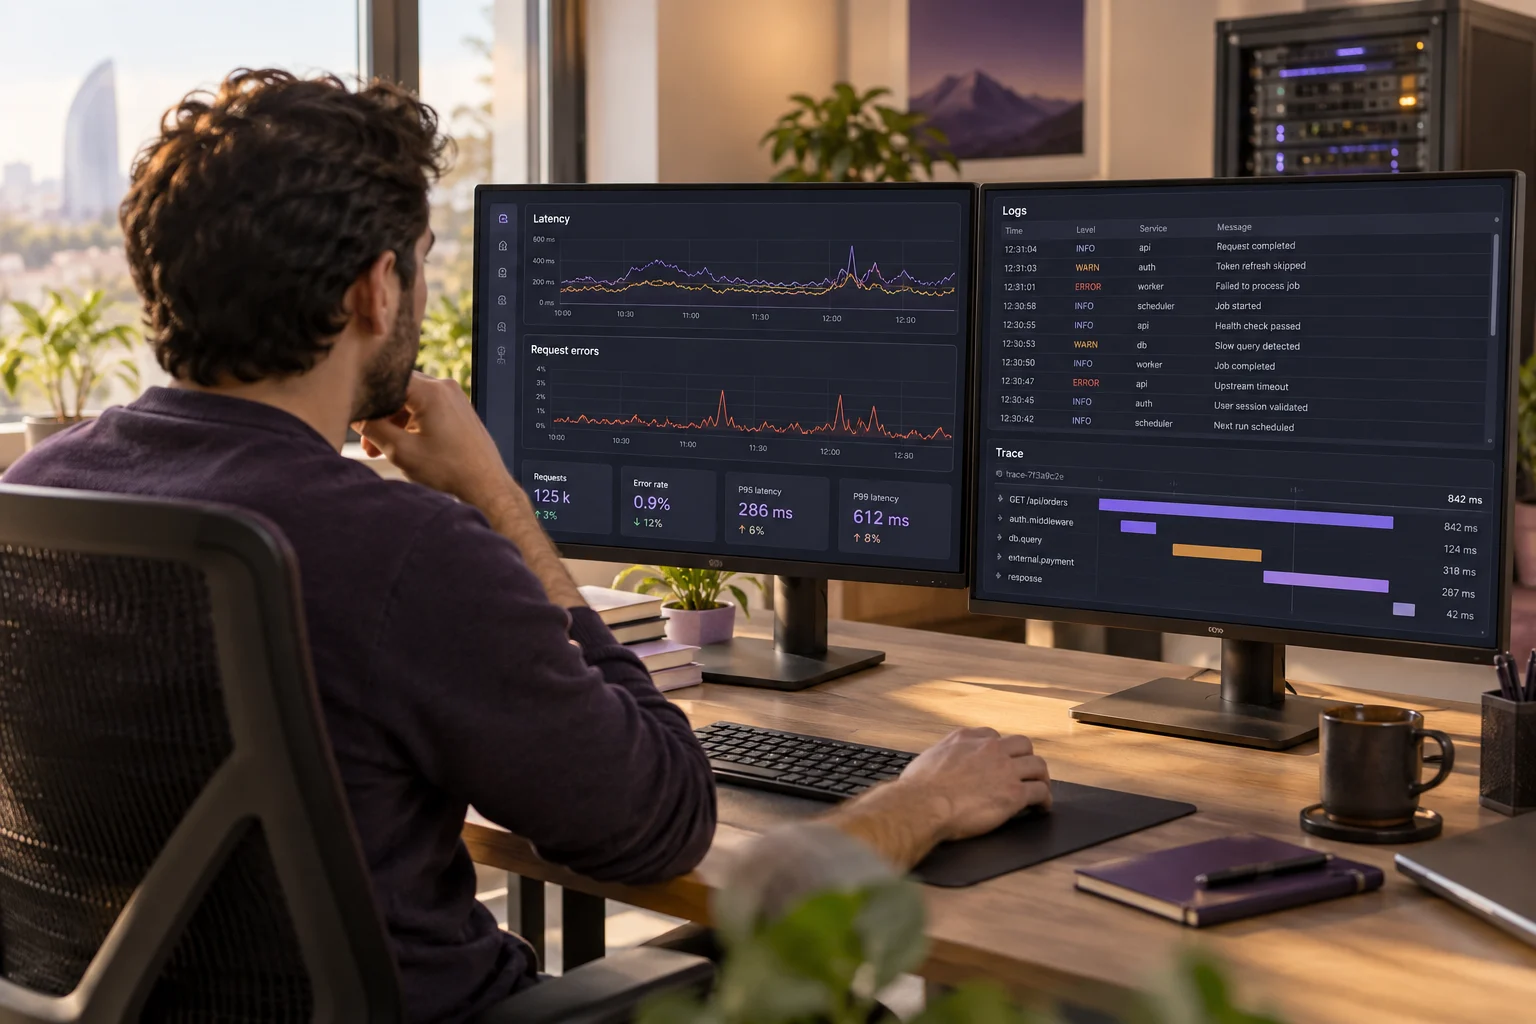
Key takeaway
Measure the latency and errors users experience, then inspect matching traces, logs and dependency metrics from the same period. A tool does not explain a problem by itself; instrumentation and context matter.
Monitoring and observability work together
Monitoring tracks known conditions and alerts a team when a threshold is crossed, such as rising errors or an unavailable service. Observability is the ability to understand internal system state from its telemetry: logs record events, metrics measure values over time, and traces show a request path across services. Monitoring helps answer “is there a problem?”; connected telemetry helps investigate “why is this request slow?” Neither automatically guarantees a root cause without suitable sources and instrumentation.
| Signal | Main question | Example |
|---|---|---|
| Metric | How much, when and how is it changing? | Request count, error rate, latency. |
| Log | What event and context occurred? | A dependency timeout and error code. |
| Trace | Which components did one request traverse? | API → service → database spans. |
Follow a request through its dependencies
Application Performance Monitoring (APM) tracks response time, errors, request volume and resource use across an application and its dependencies. For a slow request, follow its path from the API through services, databases, caches and message queues. Showing release time, version and affected region alongside performance can help locate a regression. Agents or bytecode instrumentation may add overhead and capture sensitive context; test their scope and data fields on a critical application first.
Confirm impact
Measure latency, errors and scope across real requests.
Trace the path
Connect API, service and dependency spans with a trace ID.
Compare changes
Check version, configuration and load; confirm the issue with another signal.
Connect logs to traces and metrics
In a distributed application, trace/span IDs and service context can connect log records to operations in a trace. A span describes an operation, including its start and end, status and selected safe attributes; it may run entirely within one service. Keeping every trace at high volume increases cost. Sampling reduces volume but can lose rare requests and errors. Test this on representative traffic; sampling after operations finish can prioritize errors but cannot restore data discarded earlier. OpenTelemetry provides shared signal models and collection and export components.
Log
The text and fields of one event.
Metric
A time series such as a counter, distribution or gauge.
Trace
Recorded operations within a request and their durations.
Connect DevOps feedback to releases
When the same core indicators are monitored through development, testing, release and production, teams can compare a release’s impact. Dashboards should use consistent time and service names; each alert should name an owner and a check. CPU and memory thresholds alone do not describe user impact: relate latency, errors and availability to service objectives. Prometheus collects metrics and can generate rule-based alerts; Grafana builds panels and visualizations from connected data sources.
RUM and synthetic checks cover different gaps
Real User Monitoring (RUM) gathers performance measurements from real sessions in supported browsers; synthetic monitoring replays predefined requests and journeys on a schedule. RUM can reveal differences across devices, browsers, networks and regions, but a low-traffic path may have a small sample. Synthetic checks test critical flows such as login or checkout regardless of traffic, but do not fully reproduce real user devices and networks. Use both and review what the RUM script collects, stores and transmits.
| Approach | Strength | Limit |
|---|---|---|
| RUM | Experience across real devices and networks. | Depends on traffic and script coverage. |
| Synthetic | A repeatable journey and scheduled check. | Does not fully reflect a real user’s environment. |
Interpret real-user measurements
Google Core Web Vitals measure loading, interactivity and visual stability in real user experience: LCP measures when the largest image or text block in the viewport is rendered, INP measures responsiveness to interactions, and CLS measures unexpected layout shifts. In RUM, group results by region, device and page type; one average can hide an affected group. Additional timings such as TTFB and FCP help investigate the path from server to browser.